
Benchmarking your data center’s energy efficiency is a key first step towards reducing power consumption and related energy costs. Benchmarking enables you to understand the current level of efficiency in a data center, and as you implement additional efficiency best practices, it helps you gauge the effectiveness of those efficiency efforts.
PUE & DCiE Calculator
Calculate your PUE (Power Usage Effectiveness) & DCiE and start bench-marking the efficiency within your data center.
Enter Total IT Load
kW
Enter Total Facility Load
kW
Select Country
Select State
kW/h Cost
$
Current PUE :
—
Current DCiE :
—

Annual Power Use
—

Annual Power Cost
—

Annual Carbon Footprint
—
Now that we have a benchmark of your current efficiency level, let’s go ahead and calculate potential savings if you were to improve this metric.
What is PUE? What is DCiE?
PUE / DCiE are efficiency benchmarks comparing your data center’s infrastructure to your existing IT load. The initial benchmarking of PUE / DCiE yields an efficiency score and sets a testing framework for the facility to repeat. Comparing initial and subsequent scores, data center managers can gauge the impact of what should be ongoing efficiency efforts. At any given time, they are comparing the power currently used for the IT equipment a company needs with the power used by the infrastructure which keeps that IT equipment cooled, powered, backed-up, and protected.
PUE Example:
Having a facility that uses 100,000 kW of total power of which 80,000 kW is used to power your IT equipment, would generate a PUE of 1.25. The 100,000 kW of total facility power divided by the 80,000 kW of IT power.DCiE Example:
Having that same facility that uses 100,000 kW of total power of which 80,000 kW is used to power your IT equipment, would generate a DCiE of .8. The 80,000 kW of IT power divided by the 100,000 kW of total facility power.
Generating PUE / DCiE is only a start on your path to efficiency. For this benchmark to be meaningful it should be generated on a regular basis and preferably also on different days of the week and at different times of the day. The goal being to take actionable efficiency actions based on your actual data. By comparing your starting benchmark with benchmarks taken after implementing changes, you should be able to see noticeable improvements in your PUE/DCiE.
Reduce your operation costs by utilizing measurement, benchmarking, modeling, and analysis to improve your Data Center’s energy efficiency.
PUE = Total Facility Power / IT Equipment Power
DCiE = IT Equipment Power / Total Facility Power
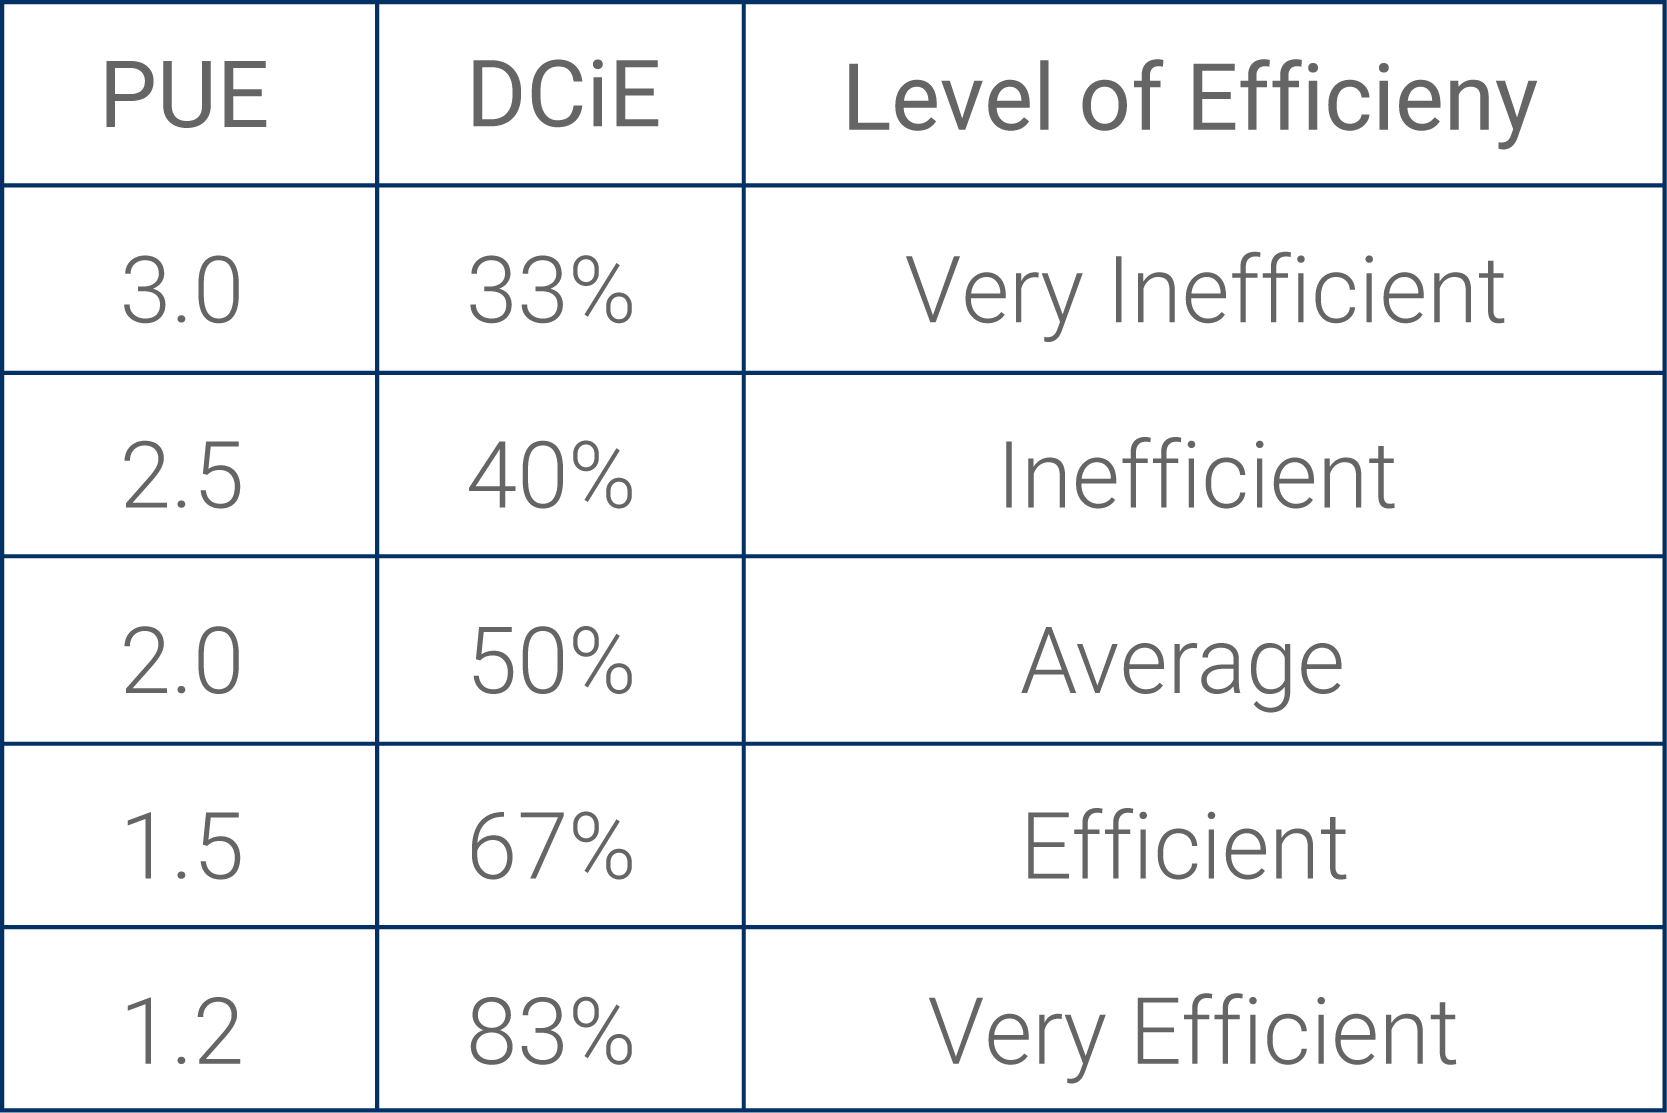
| PUE | DCiE | Level of Efficiency |
| 3.0 | 33% | Very Inefficient |
| 2.5 | 40% | Inefficient |
| 2.0 | 50% | Average |
| 1.5 | 67% | Efficient |
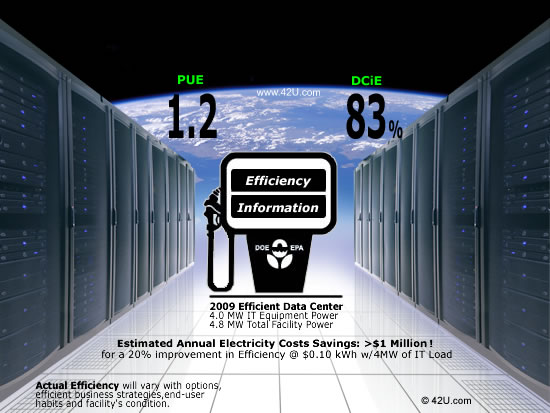
| 1.2 | 83% | Very Efficient |
DCiE and PUE Wars and Green Washing … what PUE isn’t!
You may have heard the terms “PUE Wars” or “PUE Marketing.” The Green Grid, the author of both PUE and DCiE, didn’t intend for either metric to compare one facility to another. Unfortunately that hasn’t stopped some people from publishing their PUE numbers in an attempt to market their facilities or design strategies. While their efforts to improve data center efficiency should be applauded, these metrics by themselves are not sufficient to determine data center efficiency. The conversation must include productivity. Are you getting the most out of your servers and storage? Are you maximizing processing power? Retiring idle servers? Consolidating and Virtualizing?
PUE and DCiE Benchmarking in Laymen’s Terms:
Companies and organizations need IT equipment to provide their products and services, handle transactions, provide security, and to run and grow their businesses. The larger a company / organization grows, the greater the need to house their computer equipment in a secure environment. IT equipment includes computer servers, hubs, routers, wiring patch panels and other network equipment. Depending on size, that secure environment is called a wiring closet, a computer room, a server room, or a data center. In addition to the energy needed to run that IT equipment, electric power is utilized for lights, security, backup power, and climate control to maintain temperature and humidity levels that will minimize down time due to heat issues. By benchmarking PUE or DCiE, you are comparing the power needed for business critical IT with the power keeping that IT equipment alive and protected.
All IT equipment (and anything run on electricity) generates heat. In a room filled with racks of computers and other IT equipment a significant amount of your energy costs are incurred by specialized data center cooling and power equipment deployed to keep your servers and other IT equipment up and running. Heat problems in data centers are a leading cause of downtime.
Data Centers are large complex environments and often have different strategic teams managing key components-one team focusing on the facilities management and the other on IT Equipment deployed in the facility. In these environments facilities managers usually determine infrastructure environmental issues including power, cooling, and airflow, and IT Managers determine critical IT systems such as servers and networking equipment.
PUE / DCiE Benchmarking Frequency:
To have any true value, PUE and DCiE also aren’t benchmarks that can be done once or infrequently. They should be measured on a regular, if not real-time, basis at different times of the day and week. To stress this significance, the Green Grid is introducing some additional identifiers, which in combination with the PUE benchmark score will give you a much better picture on frequency and overall meaningfulness of the PUE or DCiE resulting score.
You can’t control or manage what you don’t measure
Having a holistic understanding of your computer room or data center’s energy consumption is a key first step in being able to determine the appropriate steps necessary to improve your energy efficiency. Measuring should be used as an ongoing tool in your overall data center strategy. CFD measurement at multiple heights in a row of racks along with air pressure measurement under floor tiles can not only help you insure that you are getting enough cool air to the inlet of your servers, it can help you maintain airflow to the recommended ASHRAE level to all IT equipment (current ASHRAE inlet air recommendations are for environment range of 18°C to 27°C (64.4°F to 80.6°F) and a humidity dew point of 5.5C to 15C. This data can also help you eliminate hot aisle / cold aisle containment issues (hot air leaking into the cold aisles and vice versa). With proper power measurement of your overall data center IT equipment and infrastructure, you will be able to determine your PUE and DCiE. As PUE / DCiE are industry standards, determining your data center’s energy efficiency rating will enable you enable you to compare how efficient your facility is compared with other data centers around the world. It also helps you set a benchmark you can track, report, and continually improve. Keeping your data center energy efficient should be an ongoing process. After determining your facility’s efficiency rating, you implement power and cooling best practices to improve efficiency and then monitor how those changes improved your PUE/DCIE. And as you add additional energy efficient IT assets, the process continues showing how much less energy consumption your facility is using. Improvements in your DCiE and PUE correlate to improved efficiency, which in turn demonstrate a measurable reduction in your company’s or organization’s power bill.
How to Calculate PUE and DCiE:
PUE and DCiE: What to Measure
The concepts of PUE and DCiE seem straightforward. Yet, the intricate maze of transformers, PDUs, and chillers make the measurement more than simple arithmetic.
Calculating PUE or DCiE has more value when it becomes a repeatable process, tracked over time. The content herein is designed to assist data center professionals with that first reading, developing a protocol to repeat as efficiency efforts carry on.
Step 1: Develop a testing schedule
The frequency of PUE/DCiE measurement is dependent on the overall efficiency program. If data collection is automated through software, continuous measurement (hour to hour, minute to minute) should be possible. Loads can fluctuate throughout the work day, and professionals may find value in contrasting PUE at peak loads with the measurement at slower or idle points of the day.
Author of both PUE & DCiE, The Green Grid gives the following guidance for measurement intervals:
- Basic Efficiency Program: Monthly/Weekly
- Intermediate Efficiency Program: Daily
- Advanced Efficiency Program: Continuous (hour to hour)
Whether the calculations happen once a month or once an hour, any regular measurement is a step in the right direction.
Step 2: Plan Your Efficiency Objectives
Your efficiency plan can be as basic or as detailed as you’d like. A dedicated data center, for instance, may capture incoming electricity straight at the meter and the IT Load straight from the UPS. From there, simple division yields an efficiency score.
| Basic Calculation | |
| Total IT Load | 94kW |
| Total Facility Load | 200kW |
| PUE | 2.13 |
| DCiE | 47% |
But a number of components influence the total facility load. The cooling infrastructure may consume 40% of the incoming electricity as in the example below. For this reason, a user may want to specifically measure and trend consumption in the central plant.
| Detailed Calculation | |
| Total IT Load | 94kW |
| Cooling Infrastructure | 80kW |
| Power System Load | 24kW |
| Lighting Load | 2kW |
| Total Facility Load | 200kW |
| PUE | 2.13 |
| DCiE | 47% |
Current technologies enable very precise measurements. A building management system may be able to monitor total incoming electricity, chiller loads, and lighting loads. Cisco’s EnergyWise technology, newer rack power products, and branch circuit monitoring can all track power consumption at the device level. Remote sensors and software products can monitor kW and kWH of individual CRACs and CRAHs. As a result, users can target and improve problem areas of the data center.
This level of detail ultimately depends on your goals, facility, and budget. No matter how simple or involved the program, the most important objective is consistency. You cannot improve or control what you do not measure.
Step 3: Know the power distribution components
Electrical distribution is central to these measurements. Power flows through assorted components, and losses occur as it makes its way from a service entrance to the IT equipment. Here are some of the key power components:
Transformer
Electricity travels through the service entrance and into a transformer, which feeds everything downstream: switchgear, UPS, lighting, CRAC/CRAHs, and, eventually, the IT equipment. The uphill side of this transformer represents a potential spot for measuring total facility power.
Uninterruptible Power Supply (UPS)
Downstream from transformer, transfer switches, switchgear. This represents a potential spot for measuring total IT load.
Power Distribution Unit (PDU)
Different from a rack-based power units (where the IT equipment is actually powered), these floormount units distribute power via circuit breakers to the cabinets and racks housing IT equipment. This location, if available, represents a more comprehensive spot for measuring the IT load as it includes both the UPS and PDU electrical losses.
Step 4: Find your Total Facility Power
Transformers
Transformers do not inherently have intelligence, so metering will be necessary. Sophisticated handheld devices can provide a point in time reading of incoming electricity.
The objective, however, is to track results and improvements over time. Clamp-on meters, installed at the uphill side of the transformer, can quantify efficiency gains through ongoing measurement. The devices, housed in electrical boxes close to the transformer, have leads that install around each conductor and provide detailed readouts of each electrical phase.
Transformers are vastly important to data center operation, and some users, concerned with install complexity or a perception of downtime, may be hesitant to install such meters. Yet sound and experienced engineering can allay these concerns and position the user to save in energy costs over the lifetime of his facility.
Automatic/Static Transfer Switch (ATS / STS)
While dedicated transformer metering will provide the most accurate facility load there are situations that do not allow for metering at this point in the supply chain. The output of the ATS / STS provides optimal metering point for facilities power. In the environment that includes a backup generator, the facility power measurement at the output of the ATS / STS is the preferred point for collecting the entire facilities load as all systems required for critical operations are fed from this point.
Building Management Software
Users may already employ a building management system that continually monitors power consumption. If this is the case, the total facility power may be little more than a few clicks a way, presenting the values via a web interface.
Step 5: Find your Total IT Load
Measuring IT Load via PDU
PDU output is another measurement point. Newer PDUs with readable panels or automated branch circuit monitoring make the IT load very accessible. As mentioned earlier, PDUs can contain a number of 42-pole panels, and without automation, installing meters at each pole and managing the resultant data could prove difficult.
Keep in mind that each reading is subject to electrical losses, due to the inefficiencies of the UPS and PDUs. If you choose, you can calculate the losses by comparing each device’s input and output values.
- UPS input power (kW) – UPS output power (kW) = UPS Power Loss (kW)
- PDU input power (kW) – PDU output power (kW) = PDU Power Loss (kW)
Measuring IT Load via UPS
The UPS output is the first logical place to gather the IT load. Newer UPS systems may include readable front panels or use web interfaces, which simplify any detective work and provide a vehicle for trending data over time. Older UPS systems, without front panels or SNMP capabilities, can utilize the same clamp meters discussed in the transformer section.
Step 6: Take Meaningful Action
With the initial reading complete, identify a course of action. Consider the use of modeling or measurement tools to analyze airflow on the data center floor. Review the interrelated settings of the cooling infrastructure from chilled water temperature through server inlet temperature. Eliminate idle servers and, if possible, use virtualization technology. Then run the test once again.
If IT supports business, first and foremost, improving PUE/DCiE has a compelling business argument. Less energy consumed, smaller electric bill. Good for the environment. Good for the bottom line.
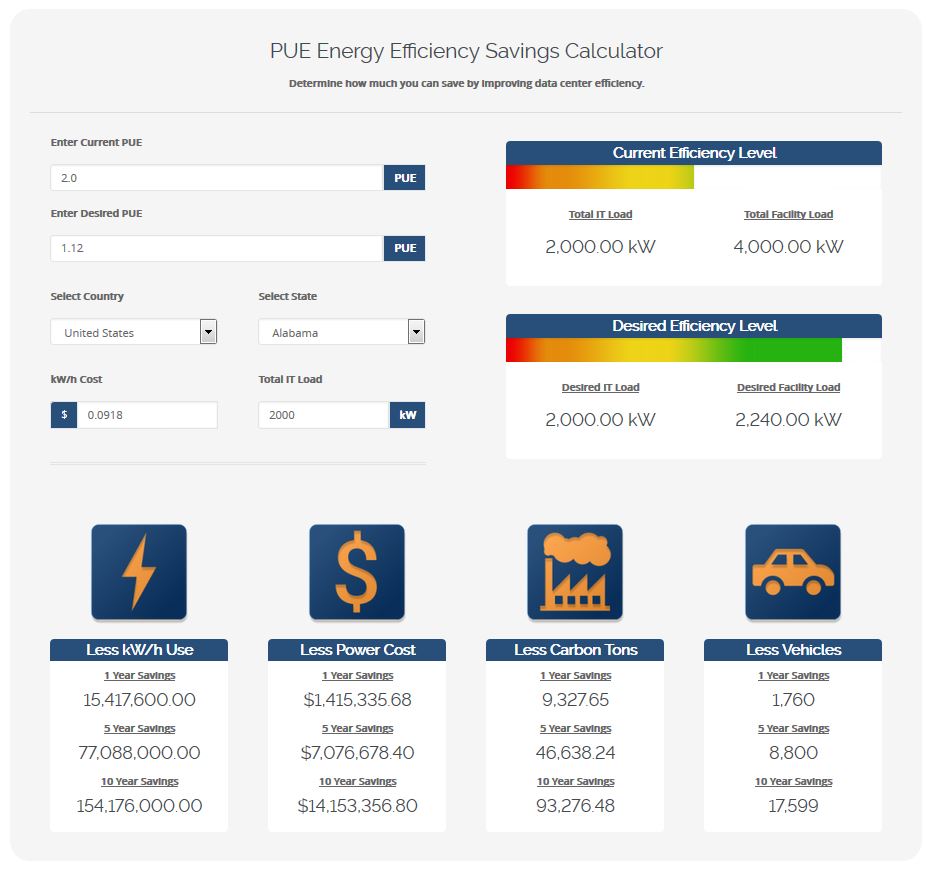
How can PUE or DCiE help you save operational costs in your data center?
The energy savings for an efficient data center are significant! After calculating your current PUE / DCiE benchmark, click here to try our interactive data center savings calculator to select different efficiency goals and see how much your organization can save in energy costs by improving your efficiency.
As much as 50% of a data center’s energy bill is from infrastructure (power & cooling equipment). Try our Interactive data center efficiency calculator and find out how reducing PUE will result in significant energy and cost savings!42U’s Data Center Efficiency Savings Calculator helps IT Professionals and C-level management understand the short term and long term savings that can be achieved by improving the energy efficiency of their data center infrastructure. Efficiency savings are both financial (Capital expense (CAPEX) and operating expense (OPEX) as well as the environmental savings in carbon emissions (the carbon given off by the electricity used to power the equipment in their data centers). Also important to consider but beyond the scope of this calculator are the substantial CAPEX savings in reducing assets and deferred data center construction, and savings in other green house gasses other than CO2. The Efficiency Savings Calculator is designed to be useful for determining savings for any size data center, computer room, server room, or wiring closet.