

Environmental Monitoring Systems for Server Racks, Server Rooms and Data Centers
42U provides cost effective approach for environmental monitoring over the network. Our solutions allow you to monitor humidity, temperature, door contact, dry contact, and other environmental conditions remotely from network closets to data centers.
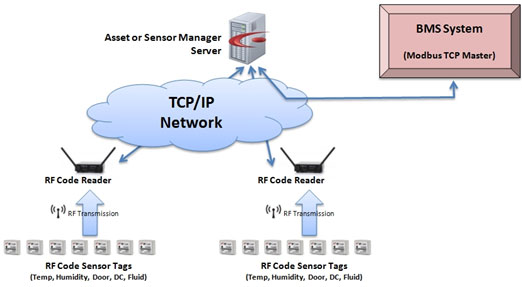
Wireless Data Center Monitoring Solutions
42U offers products that give you fully automated, real-time wire-free data center monitoring solutions, that significantly reduce the time and cost of tracking and managing IT assets and the environmental conditions that surround them.
Built on open standards, our solutions can be used alone or integrated easily into your existing technology infrastructure— from Data Center Infrastructure Management (DCIM) or Building Management Systems (BMS) software to ERP, Asset Management and other platforms.
Wireless Monitoring Features:
- Affordable, easy-to-deploy “peel and stick” wireless sensor
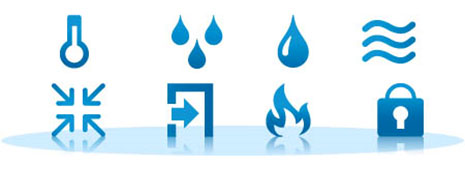
- Early warning for issues related to temperature, humidity, fluid detection, air pressure, rack level power usage and more
- Flexible configuration for affordable, complete coverage
- Real-time alerting & monitoring to reduce costs, while increasing availability
- From room size turn-key kits to larger custom data center floor applications
Wire-free data center monitoring offers the following key advantages:
- Has a lower overall cost
- Is cheaper and easier to deploy
- Saves critical rack space
- Provides massive scalability and future expansion
Wireless Monitoring White Papers
- The Wire-Free Advantage: Six Leading Benefits of Sensor Networks in Data Centers
- Best Practices for Wire-free Environmental Monitoring in the Data Center
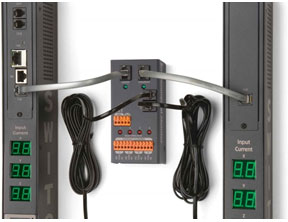
PDU Environmental Sensors
Environmental sensors can be deployed as plug-and-play options for many intelligent rack PDUs and inline power meters. This type of monitoring eliminates the need for a separate controller. Environment data is instantly sent to the PDUs onboard software. A simple web-based interface allows data center managers to see real-time environment data, report trends over time as well as set alert thresholds.
Environmental sensors enable data center managers to:
- Ensure uptime by monitoring racks for potential hot spots.
- Save on cooling by confidently raising data center temperatures
- Improve data center availability by receiving environment alerts
- Make strategic decisions on cooling and containment
- Set thresholds and alerts to monitor onsite or remote facilities
Wired Monitoring Solutions
Smart Rack Controller Monitoring
Smart rack controller monitoring is a central access point for all of Raritan’s environmental sensors such as temperature and humidity, and in conjunction with Raritan’s data center infrastructure management solution (DCIM) provides sensor readings and asset management.
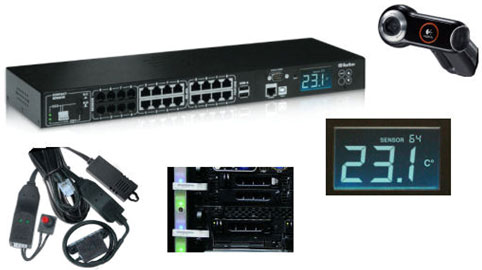
The EMX smart rack controller offers up to eight sensor ports, eight feature ports for Raritan’s dynamic asset-tracking solution and eight RS-485 ports, all in a 1U form factor. Raritan’s rack monitoring solution helps data center and facilities managers:
- Maintain Optimal Temperature: Use temperature information to optimize the cooling system and raise the ambient temperature to save energy with confidence that you won’t overheat sensitive IT equipment.
- Keep Your Humidity In Check: Maintain proper humidity levels and avoid electrostatic discharge (ESD) problems when humidity is low and condensation problems when humidity is high.
- Maintain Optimal Pressure: Identify air pressure differences that could lead to hot aisle/cold aisle partition leaks, and cut off unnecessary air flow to save energy.
- Secure Your Cabinets: Use a contact closure sensor to trigger an event such as taking a webcam picture when a cabinet door is opened.
- Detect Water Leaks: Detect if there is a water leak from external sources or from pipes in a water-cooled rack. Also works with 50% glycol mixture
- Monitor and Manage Airflow: Monitor flow rates of cooling and hot air return to ensure cooling and containment systems are functioning optimally.